Bitcoin, Ethereum, Cryptocurrency, BTC/USD, ETH/USD – Talking Points:
- The long-term outlook for both Bitcoin and Ethereum remains skewed to the topside.
- However, both cryptocurrencies could be at risk of a near-term pullback as their respective surges higher appear relatively overextended.
As mentioned in previous reports, the provision of extraordinary fiscal and monetary stimulus measures in response to the novel coronavirus pandemic has underpinned Bitcoin and Ethereum prices since the March 2020 nadir.
Although the longer-term outlook for both cryptocurrencies remains overly bullish, their recent topside surges appear somewhat overextended. This suggests a near-term pullback could be at hand. Here are the key technical levels to watch for BTC and ETH in the weeks ahead.
Bitcoin (BTC) Weekly Chart – 300% Fibonacci Capping Topside Potential
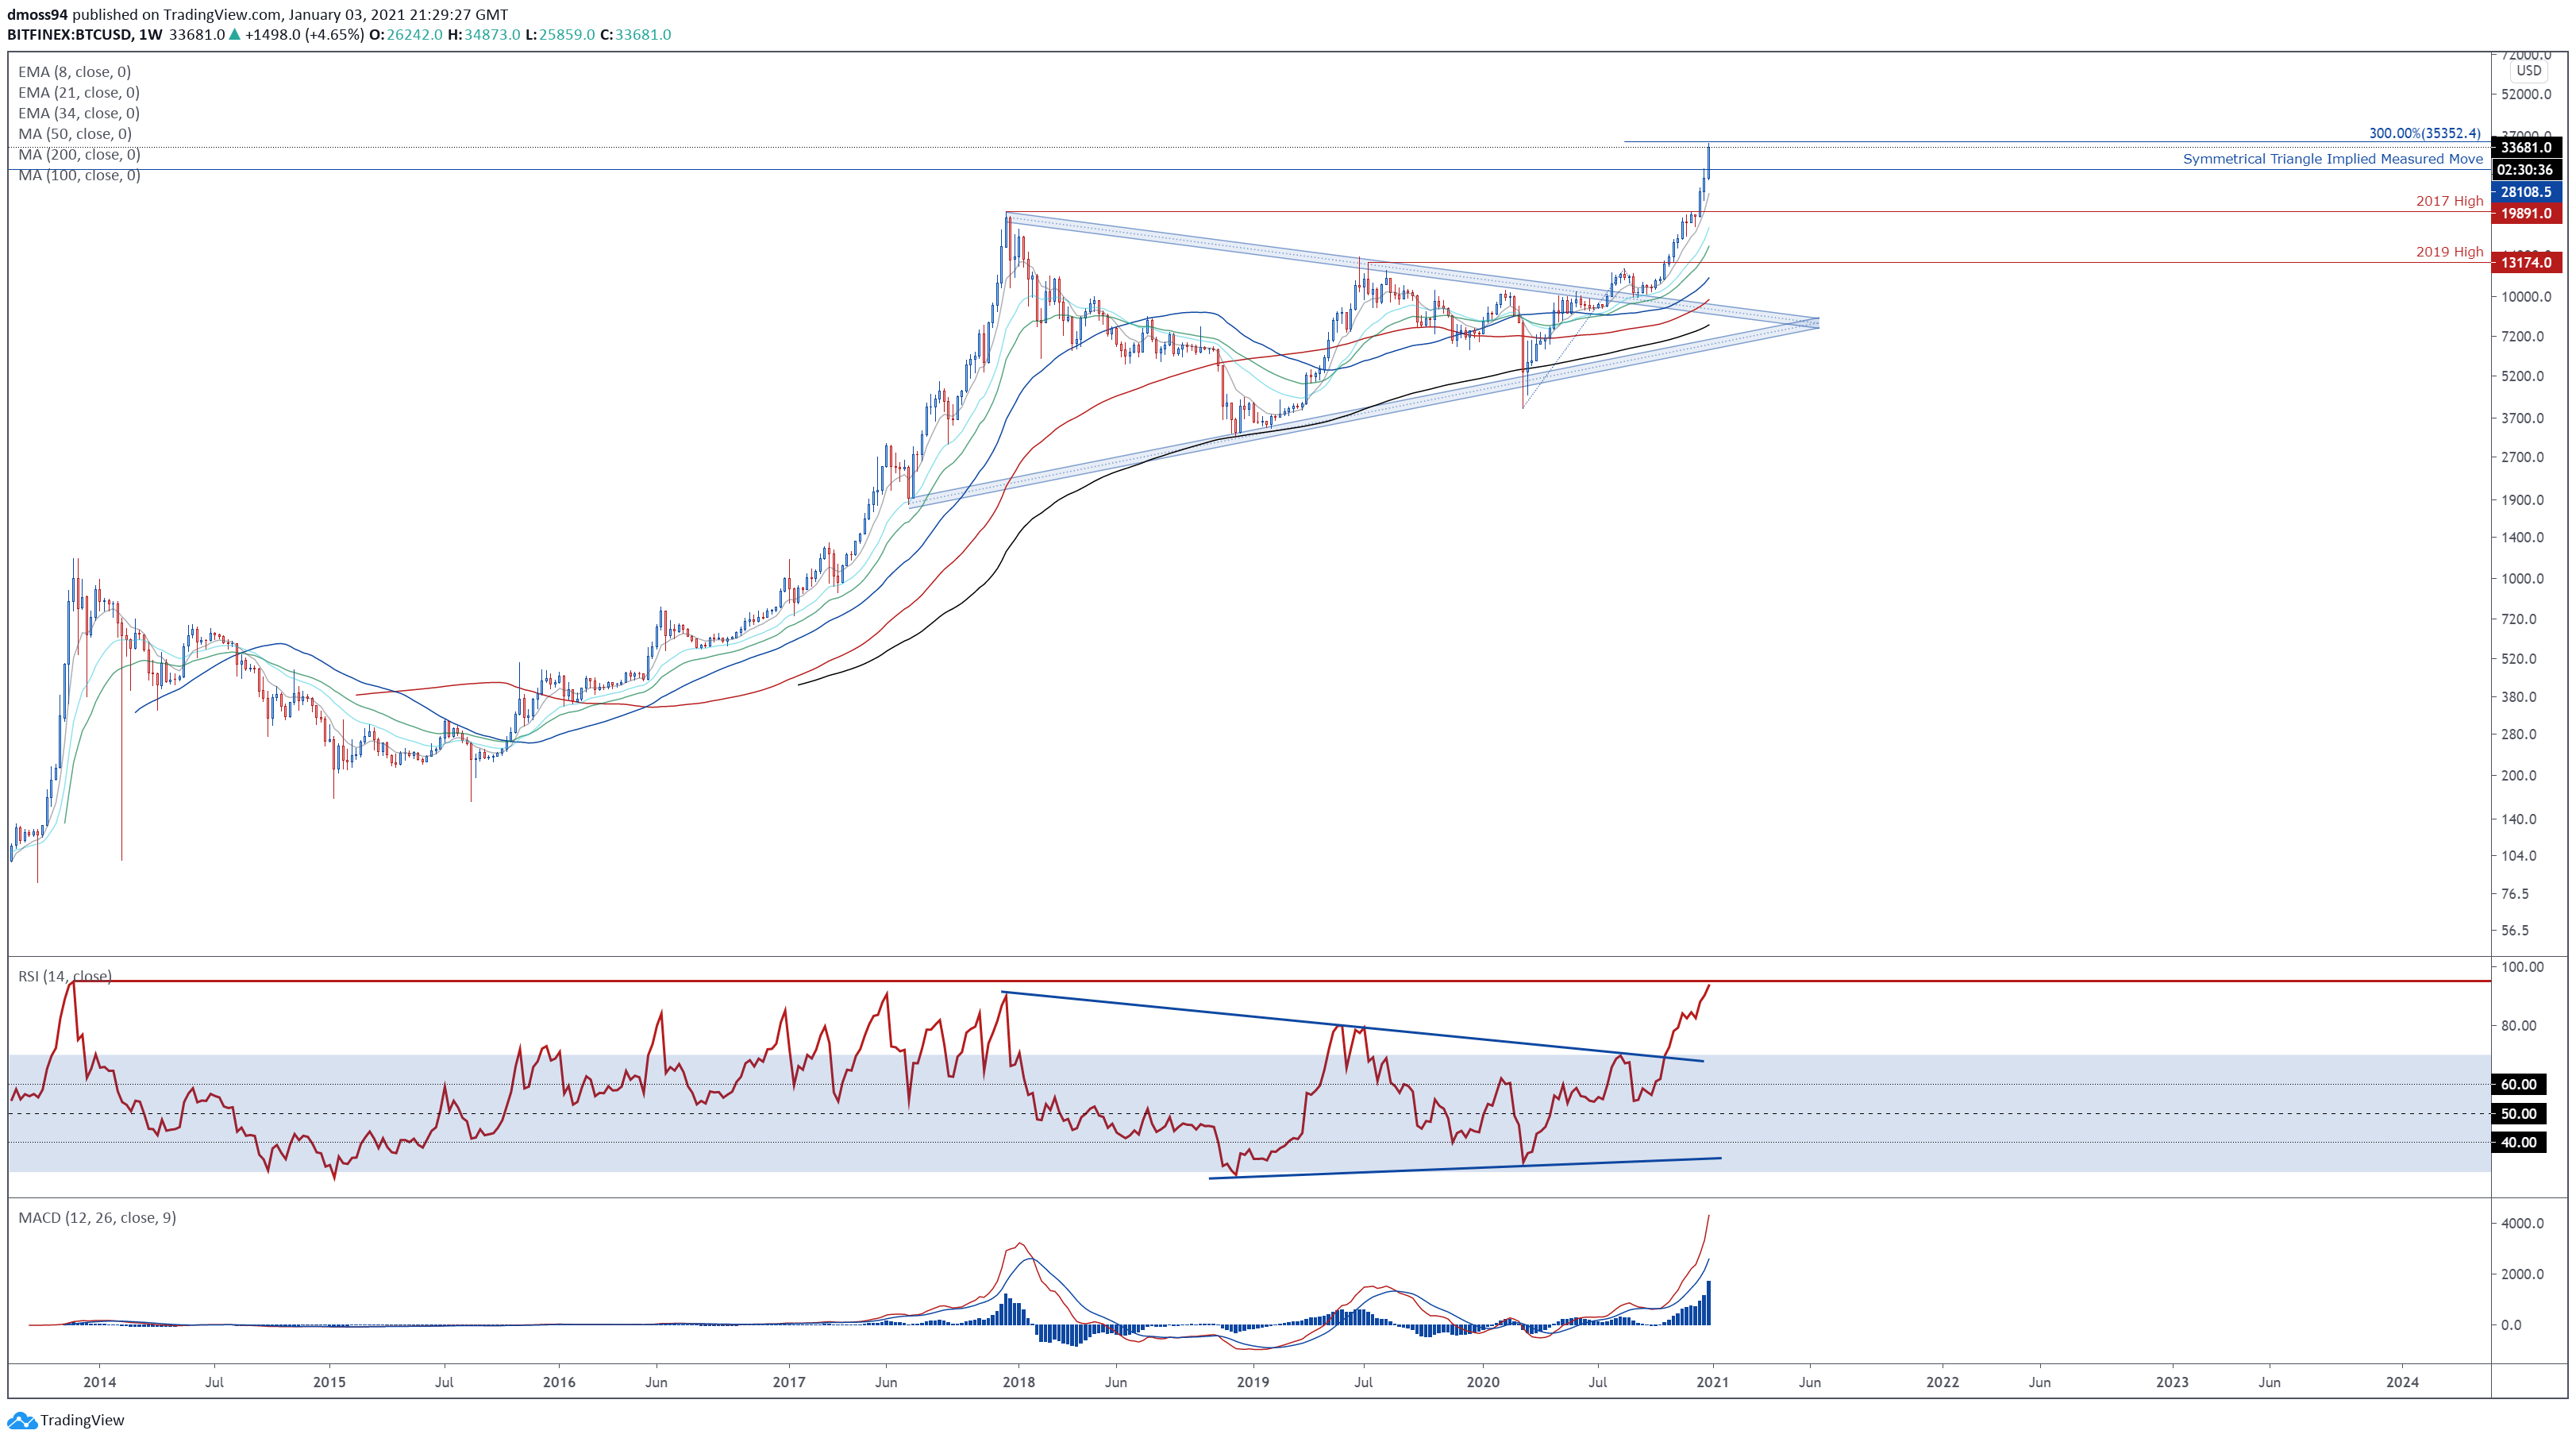
Bitcoin weekly chart created using Tradingview
Bitcoin has surged over 83% in the last 3 weeks after pushing above the psychologically imposing $30,000 mark, with prices now probing key resistance at the 300% Fibonacci expansion level (35352).
However, with the RSI approaching its highest weekly overbought readings since 2013, and prices tracking substantially above the 8-week exponential moving average (23110), a correction lower looks likely in the near term.
Failing to gain a firm foothold above $35,000 would likely allow sellers to drive prices back towards psychological support at $30,000, with a break below carving a path to test former resistance-turned-support at the Symmetrical Triangle’s implied measured move (28108).
Alternatively, a convincing push above the 300% Fibonacci could bring the $40,000 mark into the crosshairs.
Bitcoin (BTC) Daily Chart – Shooting Star Hints at Short-Term Pullback
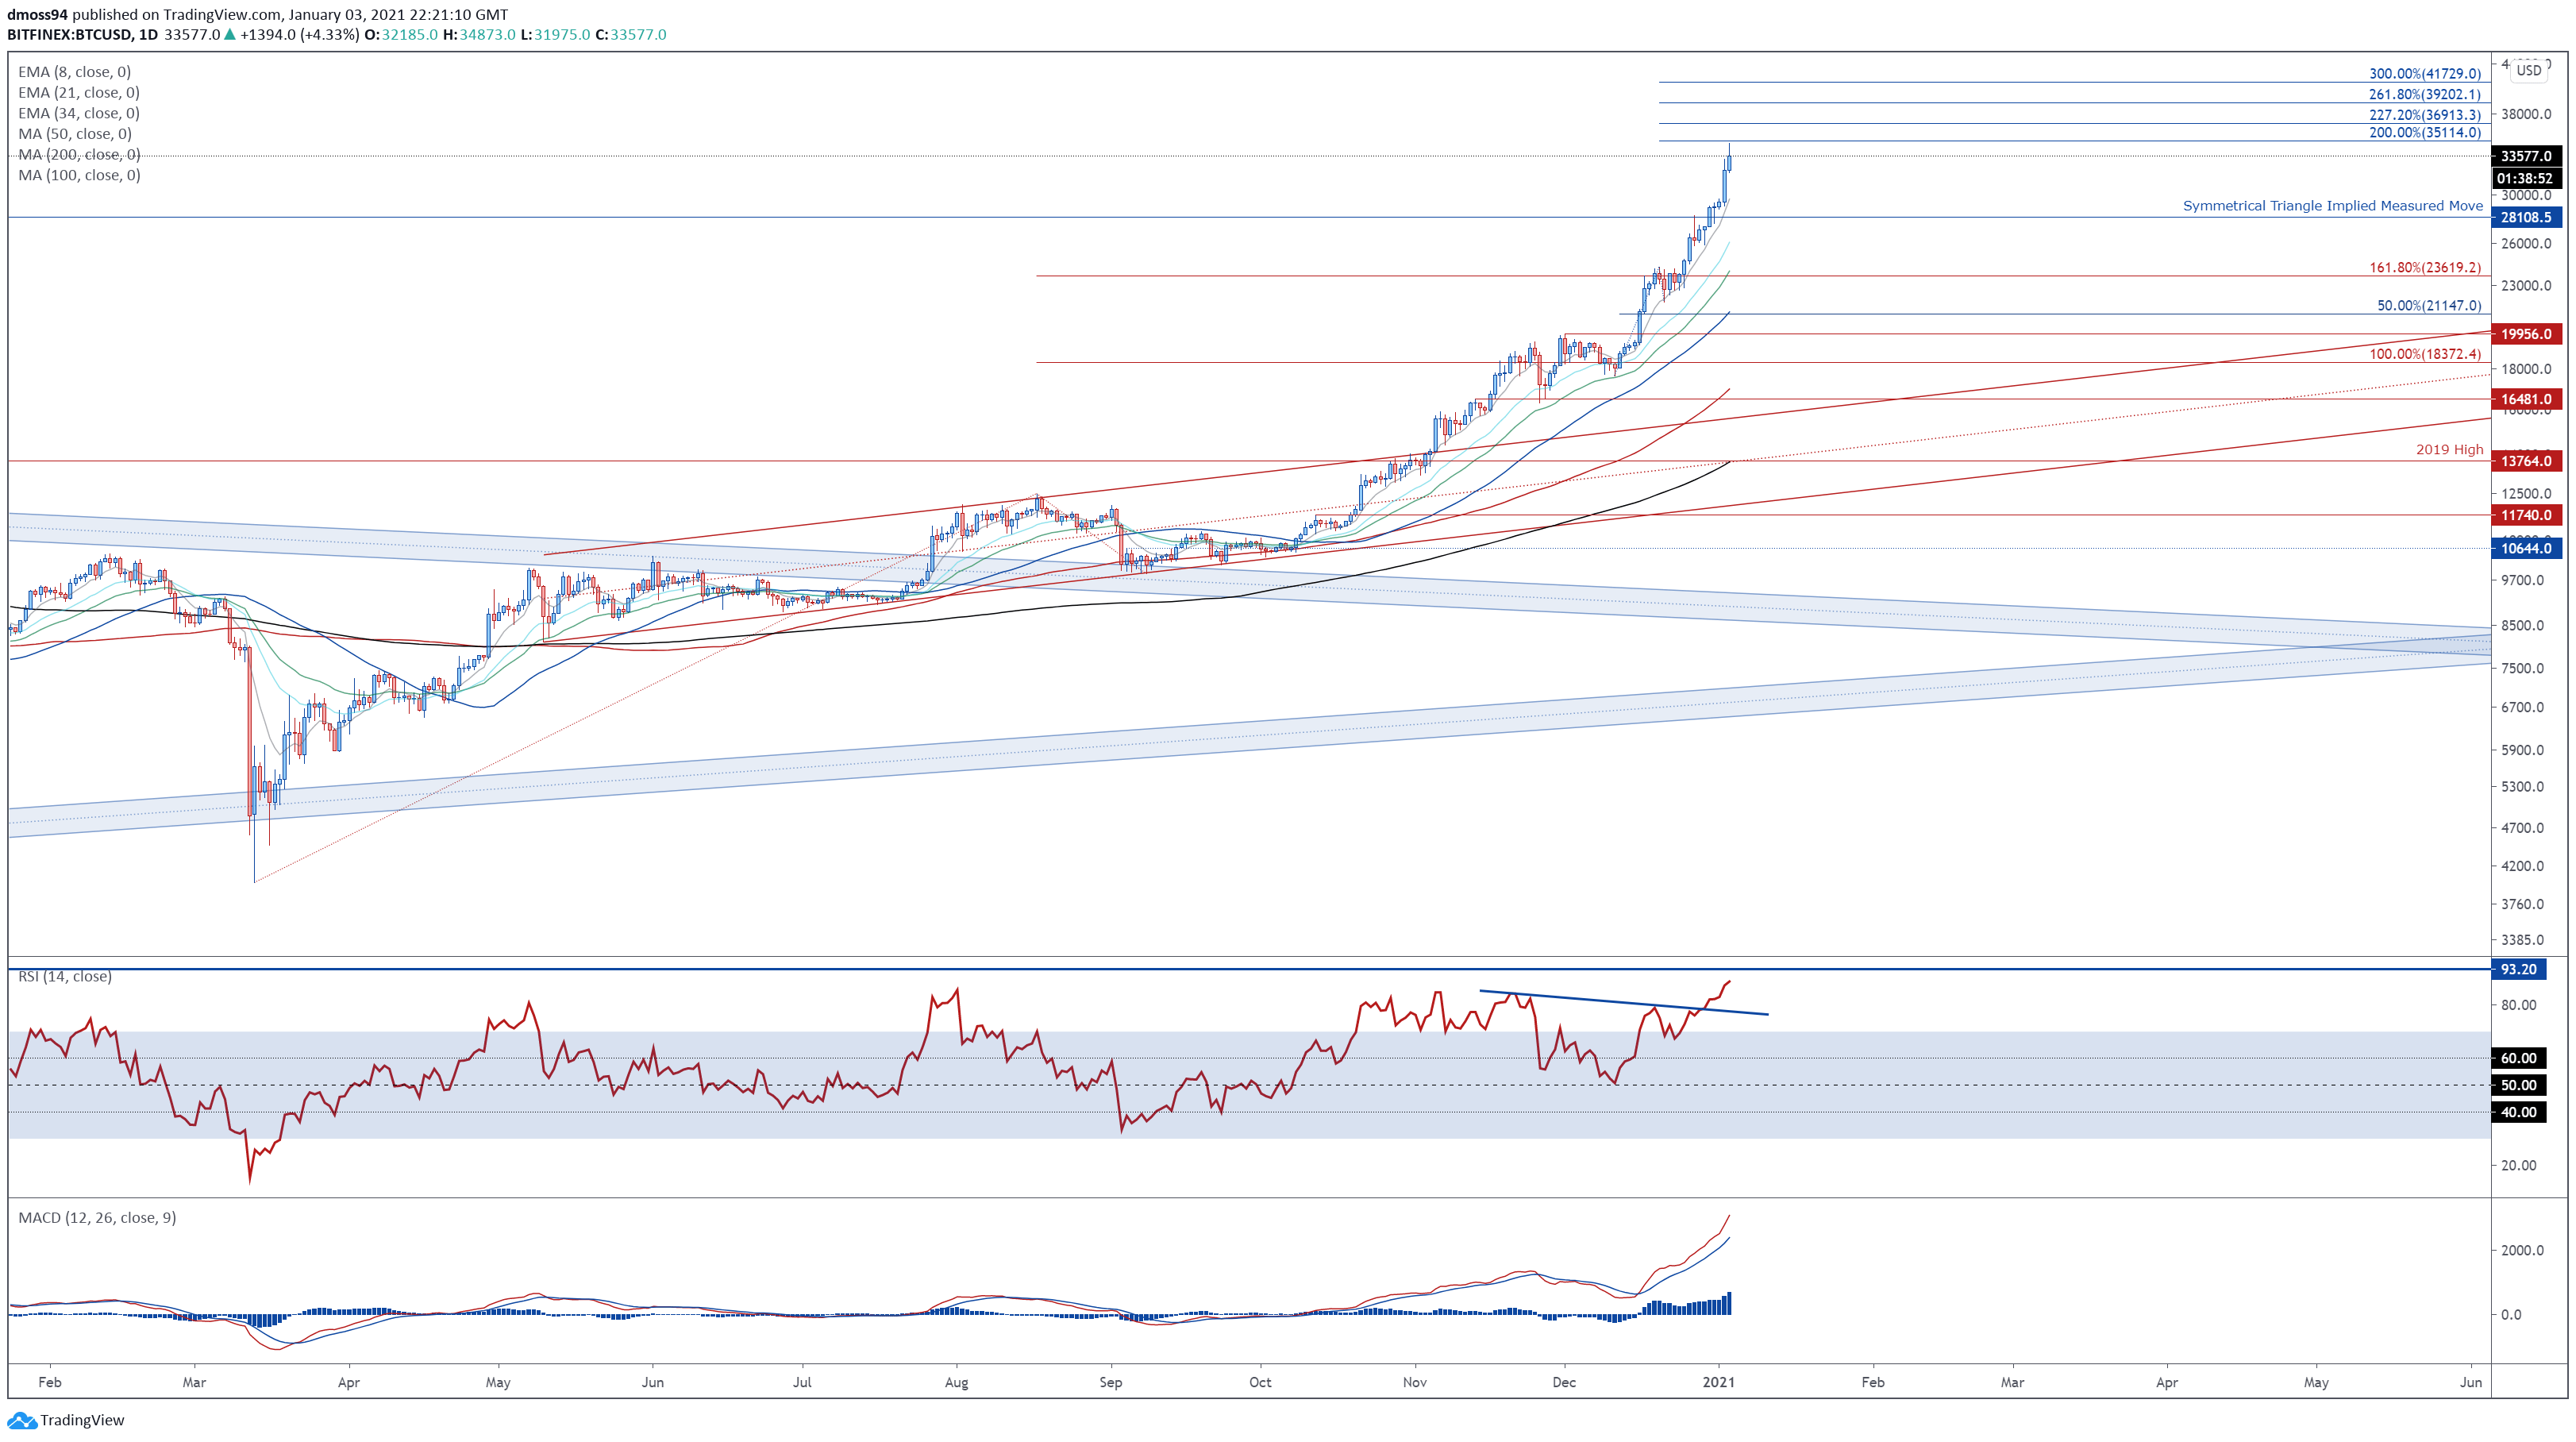
Bitcoin daily chart created using Tradingview
Zooming into the daily timeframe also hints at the possibility of a short-term pullback for the popular cryptocurrency, as a bearish Shooting Star candlestick begins to take shape just shy of the 200% Fibonacci expansion (35114).
A reversal back towards psychological support at $30,000 looks on the cards if buyers fail to hurdle Fibonacci resistance. Clearing that would probably propel Bitcoin back to support at the December 27 high (28244).
On the other hand, a daily close above $35,000 could see prices push towards the 227.2% Fibonacci (36913).
Ethereum (ETH) Weekly Chart – Eyeing Key Resistance at $1000

Ethereum weekly chart created using Tradingview
Ethereum has also stormed higher in the last 3 weeks, climbing over 65% to test key resistance at the February 2018 high (979).
However, with the RSI surging to its most overbought readings since 2018, the second-most heavily traded cryptocurrency could be at risk of a reversal lower in the near term.
Failing to clear the $1000 mark could generate a downside push towards the May 2018 high (838), with a break below bringing the $700 level into focus.
Conversely, breaching psychological resistance could neutralize near-term selling pressure and carve a path for price to challenge the record high (1424) set in January 2018.
Ethereum (ETH) Daily Chart – 200% Fibonacci Coming Into Focus

Ethereum daily chart created using Tradingview
The daily timeframe, however, hints at further upside for Ethereum in the near term, as buyers drive prices through a flurry of key resistance levels at the 161.8% Fibonacci (956.27) and February 2018 high (979).
That being said, the recent topside push does appear to be overextended, given the distance price is travelling from the 8-day EMA (781.45) and the extreme overbought readings seen on the RSI.
Therefore, an aggressive pullback towards the May 2018 high (838) could be in the offing if price fails to close above psychological resistance at $1000 on a daily close basis.
Clearing that probably precipitates a challenge of former resistance-turned-support at the December high (757.67).
On the contrary, a daily close above $1000 could open the door for buyers to begin probing the 200% Fibonacci expansion level (1108.76).
-- Written by Daniel Moss, Analyst for DailyFX
Follow me on Twitter @DanielGMoss

Recommended by Daniel Moss
Improve your trading with IG Client Sentiment Data
https://ift.tt/2XdE6gB
Business
Bagikan Berita Ini


0 Response to "Bitcoin, Ethereum Outlook: Cryptos Go Parabolic, is a Correction Due? - DailyFX"
Post a Comment